 YIDINGAIR FILTRATION
Get a quote↗
YIDINGAIR FILTRATION
Technical Guides
2026-11-10
HEPA performance depends on particle size, operating airflow and resistance—not the efficiency label alone. This engineering analysis connects MPPS, media velocity and fan energy with a practical specification framework.
Key points
A meaningful HEPA comparison requires three linked quantities: particle penetration, airflow rate and pressure drop. A high efficiency measured at one operating point does not describe every possible duty. Likewise, a low resistance value is incomplete without the flow at which it was measured. This article develops a specification method that keeps these quantities together, using published filtration literature and an illustrative energy calculation. It is an engineering review, not a report of new Yiding laboratory measurements.
The central question is whether a selected filter delivers the required particle performance at the airflow the installation must sustain. Begin with that duty, then compare suitable media packs, frame depths and housing interfaces. This sequence prevents a procurement decision based on an isolated percentage or a pressure value taken from a different catalogue operating point.
A fibrous HEPA medium captures particles by several mechanisms rather than acting as a screen with one sharply defined hole size. Diffusion promotes collection of very small particles; interception and inertial effects contribute differently as particle size changes. The resulting fractional-efficiency curve has a minimum. The particle size at that minimum is the most penetrating particle size, or MPPS. Smaller does not automatically mean harder to filter. [1]
The familiar 0.3 µm value appears in the U.S. EPA explanation of HEPA. It should not be substituted automatically for the measured MPPS of every filter and test condition. [2] Research reported by Lawrence Livermore National Laboratory identifies media construction, aerosol density and air velocity as factors affecting the size of greatest penetration. [3] For purchasing, request the test method and operating flow associated with the reported efficiency rather than treating a particle-size label as a universal cut-off.
For a defined particle-size interval, let Cᵤ and C_d denote comparable upstream and downstream particle concentrations. Penetration is P = C_d / Cᵤ; fractional efficiency is η = 1 − P. Multiply by 100 to express either as a percentage. These simple ratios help explain why small numerical changes near 100% can still represent large changes in downstream concentration.
For example, an illustrative efficiency of 99.95% leaves 0.05% penetration, while 99.995% leaves 0.005%: a tenfold difference in penetration at otherwise identical conditions. This arithmetic is not a tenfold improvement in room cleanliness. Room sources, air distribution and installation leakage remain separate variables. Specify the classification system and edition on the order. ISO 29463-1:2024 covers classification, test requirements, marking and documentation with its companion test parts. [4] A class designation and a single efficiency percentage are not substitutes for a complete report.
Two velocities matter when reading a filter specification. Face velocity uses an identified frontal area. Media velocity uses the effective unfolded area of medium through which air passes. They share the relationship v = Q / A, but their denominators are different. Always state whether the frontal area includes the frame, or only the clear opening; otherwise two quoted velocities may describe different measurements.
In a purely illustrative example, 1800 m³/h equals 0.50 m³/s. Through a stated frontal area of 0.36 m², the calculated face velocity is 1.39 m/s. Through 10 m² of effective medium, the average media velocity is 0.050 m/s. These areas are calculation inputs, not dimensions or media-area claims for a Yiding model. The distinction explains why outside dimensions alone cannot establish equivalent filtration conditions. Ask for the actual rated-flow performance of each proposed construction; do not infer it from panel size or pleat count.
Pressure drop, Δp, is the pressure difference across the defined component. For a useful comparison, keep airflow, measurement boundaries and filter condition consistent. A clean-filter value cannot be compared directly with a loaded-filter value, and a filter-only measurement cannot represent the resistance of a complete terminal module.
For an enquiry, ask for initial pressure drop at the design flow and the usable flow–resistance curve. Record the system's available pressure and control mode alongside those data. With fixed fan speed, adding resistance can reduce delivered flow; a control system maintaining constant flow may instead increase fan effort within its operating capability. Fan selection therefore requires the system curve as well as the component data. [5] Do not apply a universal linear or square-law multiplier to every HEPA pack: use the measured curve over the intended range.
For steady flow, air power is Q × Δp. Dividing by an appropriate overall fan, motor and drive efficiency gives an approximate electrical-power contribution. [5] To compare two filters at the same maintained flow, use ΔPₑ ≈ Q × δp / η_total, where δp is the difference in their pressure drops. Q must be in m³/s, pressure in Pa, and efficiency a decimal fraction. The result is in watts.
Assume Q = 1800 m³/h = 0.50 m³/s, a sustained resistance difference of 100 Pa, η_total = 0.60 and 4000 operating hours. The calculated difference is about 83 W, or 333 kWh over those hours. These are selected scenario assumptions, not measured product savings. If resistance changes with loading, the calculation must follow that change over time. If fan efficiency or delivered flow changes, the estimate must also change. Neither a lower clean-filter resistance nor a higher HEPA class, by itself, establishes annual energy consumption.
Illustrative calculation only: 0.50 × 100 / 0.60 = 83.3 W; 83.3 × 4000 / 1000 ≈ 333 kWh. Both alternatives are assumed to satisfy the same required filtration duty.
Use the following matrix to make competing proposals comparable. The purpose is to identify the evidence behind each selection, not to prescribe one universal airflow, pressure limit or service life. Keep component performance separate from installed-system acceptance.
| Comparison item | Information to request | Interpretation |
|---|---|---|
| Particle performance | Class, standard edition, test flow and test report | Read the efficiency together with its test basis. |
| Airflow | Design flow in m³/h and permitted operating range | Check the delivered duty, not only the model name. |
| Resistance | Initial Δp in Pa at the same flow; performance curve | Compare equivalent boundaries and filter condition. |
| Geometry | Actual dimensions in mm, clear opening and interface drawing | Distinguish installation fit from effective media area. |
| Service assessment | Pressure trend, airflow verification and agreed replacement criteria | A single initial reading does not predict service life. |
| Acceptance | Factory documentation and applicable installed-system checks | An efficiency report does not establish housing integrity. |
Factory classification describes the tested filter under its specified method. Installed performance also depends on the housing, seals, handling and airflow arrangement. ISO 14644-3 addresses cleanroom performance testing; the relevant installation test plan must be selected for the facility and its operating state. [6] This is a different question from choosing a media efficiency class.
For a replacement, retain traceability between the quotation, drawing, delivered filter identification and acceptance documents. For a new installation, agree the airflow measurement and installation checks before procurement. This creates a practical evidence chain: defined duty, documented filter selection, correct installation and verified operating conditions. No single catalogue percentage can replace that sequence.
Yiding's AR302 mini-pleat and AR303 V-bank product families provide different formats for discussing a HEPA requirement. Choose a format after defining the installation envelope and operating duty; the format name alone does not establish equivalence. Send actual width × height × depth in mm, the required class and standard, design airflow in m³/h, allowable initial pressure drop in Pa, housing and seal details, operating conditions and quantity.
Request a quotation that identifies the selected configuration and its performance basis. For a comparison involving an existing filter, include its label, drawing and available report. This allows the technical discussion to focus on matched conditions, with dimensions, media, frame and sealing options addressed explicitly.
No. It is not a pore-size cut-off. Capture varies with particle size, and MPPS identifies the least efficiently captured size under the stated test conditions.
Yes. The class describes particle performance under its test basis. Compare pressure drop separately at the same airflow, with equivalent measurement boundaries.
No. Effective area helps define media velocity, but selection still requires the complete filter's efficiency, resistance, geometry and installation compatibility.
No. It is an illustrative calculation using stated airflow, resistance difference, efficiency and operating hours. Product-specific estimates require the selected configuration and operating profile.
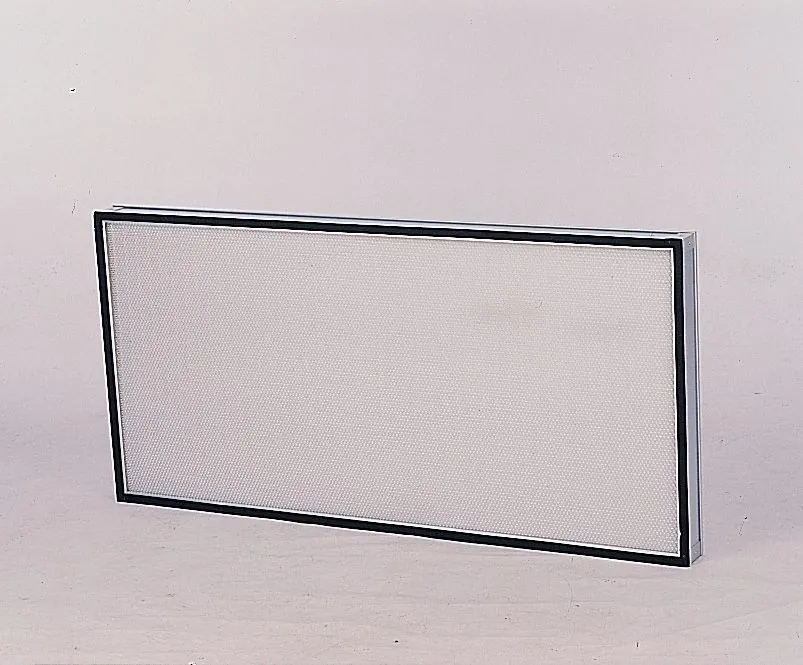
Low-profile filtration for critical clean environments.
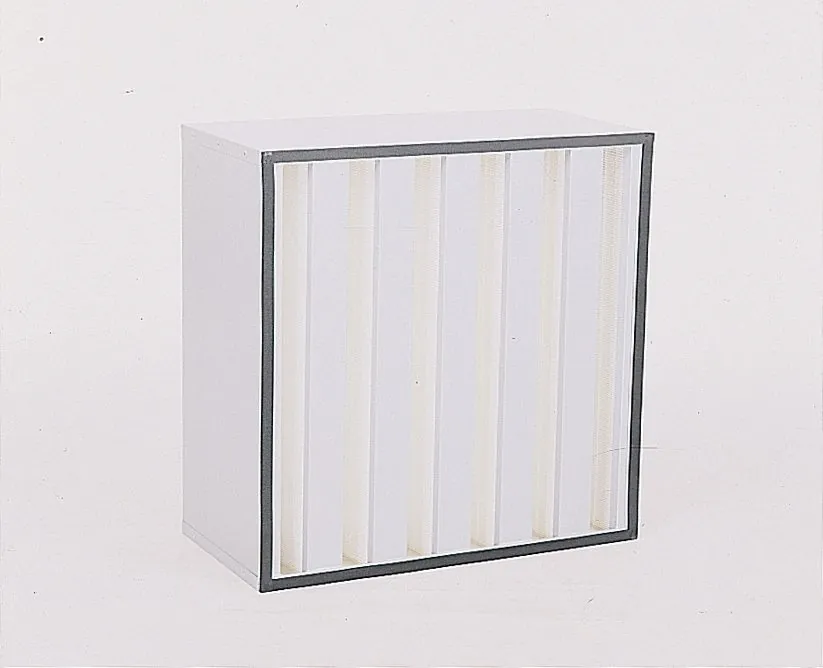
High-area filtration in a compact V-bank format.
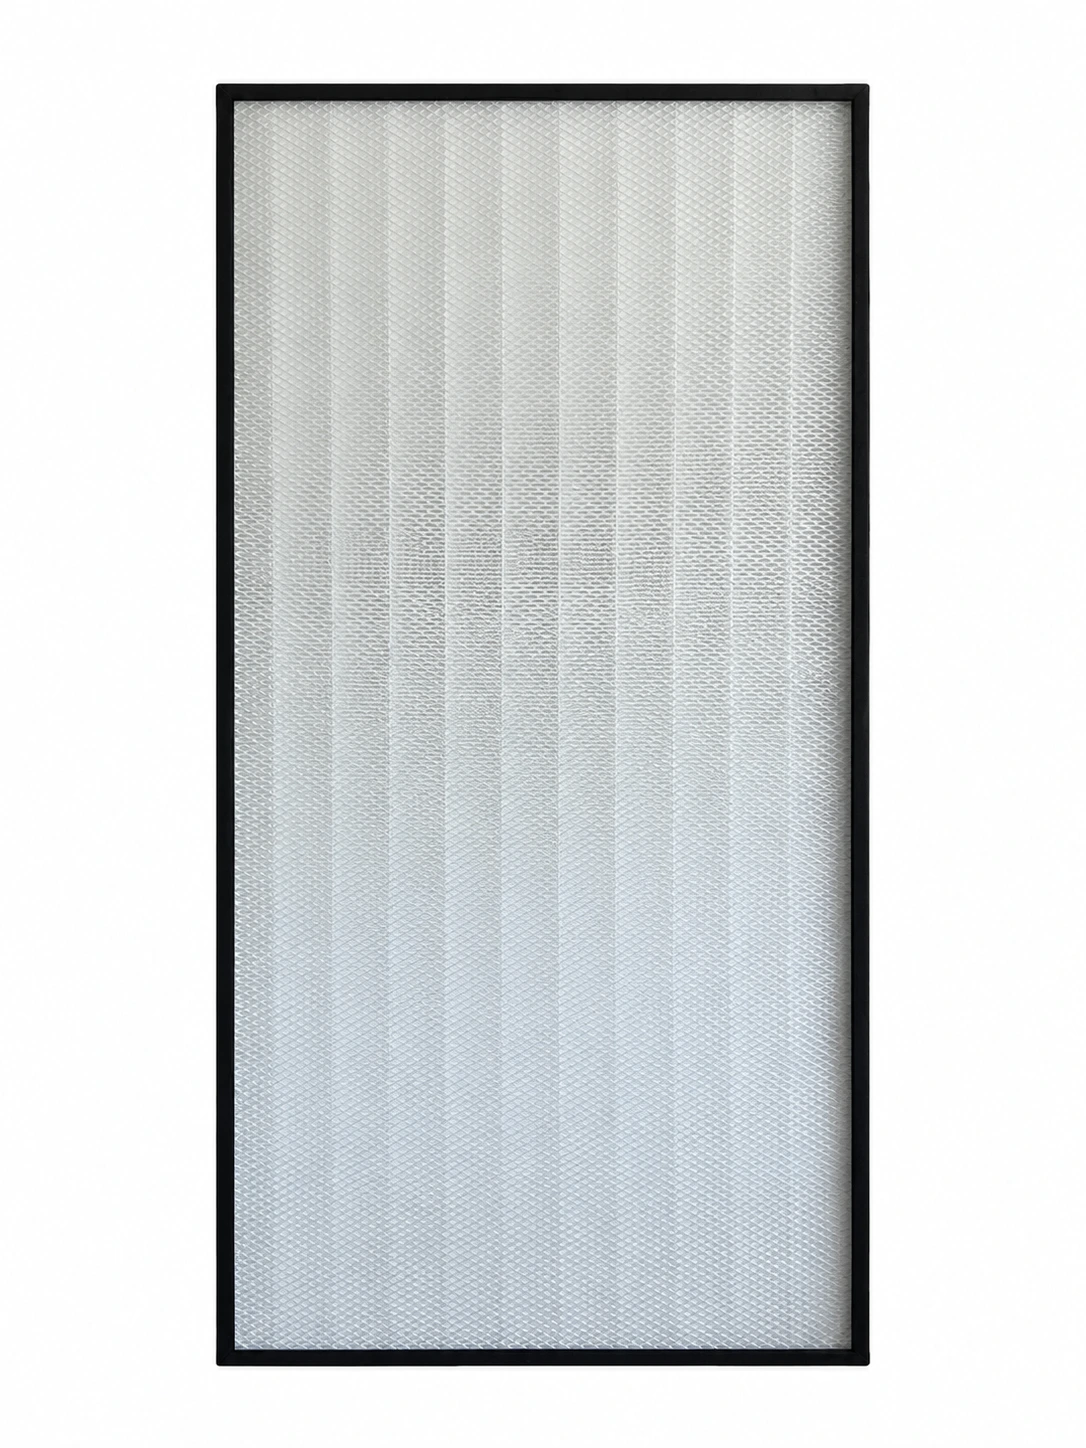
1170 × 570 × 70 mm. Dual face guards and black gaskets on both sides.